
DeveloperProductivity Post #2740 · source on Telegram
Developer Productivity as a Daily Trace
Description
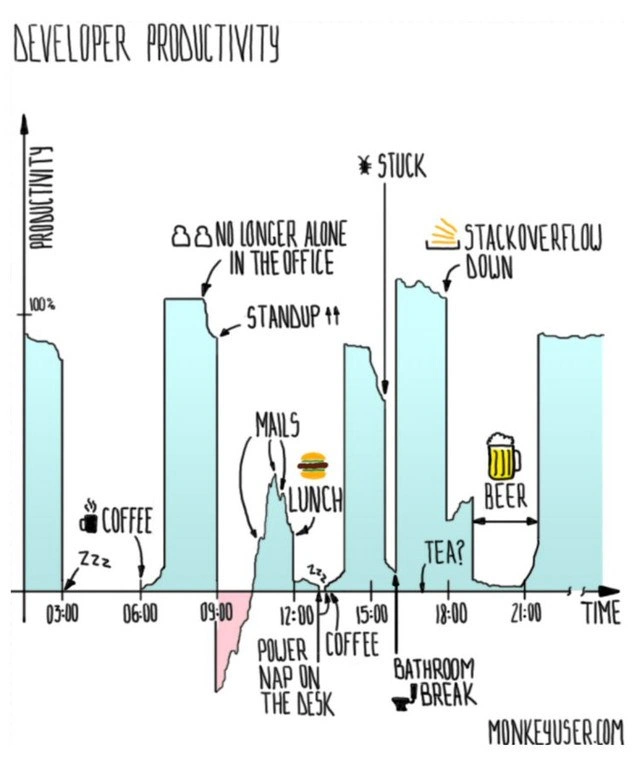
A hand-drawn chart titled "DEVELOPER PRODUCTIVITY" plots "PRODUCTIVITY" on the vertical axis against "TIME" on the horizontal axis, with a pale blue filled line rising and crashing through the day. Visible annotations include "Zzz," "COFFEE," "NO LONGER ALONE IN THE OFFICE," "STANDUP ++," "MAILS," "LUNCH," "POWER NAP ON THE DESK," another "COFFEE," "STUCK," "BATHROOM BREAK," "STACKOVERFLOW DOWN," "TEA?," and "BEER," with time marks around 03:00, 06:00, 09:00, 12:00, 15:00, 18:00, and 21:00. The bottom right credits "MONKEYUSER.COM." The technical joke is that developer output is shown as a fragile function of sleep, caffeine, standups, email, Stack Overflow availability, and interruptions rather than a simple eight-hour work block.
More like this
More like this in DeveloperProductivity →

Use J and K for navigation
Comments
7Comment deleted
It is a distributed trace of a workday, except every slow span is either standup, caffeine, or Stack Overflow returning 503.
Sadly it's not only developer's issue. Comment deleted
So... I just need to sleep 24 hours per day and i will get 100% productivity?!?! Thanks! Comment deleted
no, you understood the graph incorrectly. You start sleeping at 3:00 Comment deleted
ohh okey, thanks for ruining it😒 Comment deleted
np, I'm very good at that Comment deleted
wtf is that lol Comment deleted