Skip to content
DevMeme
3651 of 7435
The Dunning-Kruger Rollercoaster
MentalHealth Post #3989, on Nov 30, 2021 in TG

The Dunning-Kruger Rollercoaster

Why is this MentalHealth meme funny?

Level 1: Learning is a Roller Coaster

Imagine learning something new is like riding a roller coaster. At first, when you barely start, you might have a little success and feel super happy and proud – like you’ve zoomed up to a high point thinking, “Wow, I’m amazing at this!” 🎈 But then, as you try to do more, suddenly you run into something really hard. It feels like the roller coaster just dropped down fast and your excitement turns into “Uh-oh, I actually have no idea what I’m doing...” 😧. After that scary drop, you don’t quit – you keep learning and practicing. Slowly, you start to understand things better and you go back up, feeling good about yourself again. “Okay, I can do this,” you tell yourself as confidence rises. But guess what? Sooner or later, another new challenge appears – and boom, down you go again into confusion or doubt. It’s up and down, up and down, just like a real roller coaster with lots of hills. This meme is funny because it shows that exact feeling with a little drawing: a smooth, pretend-easy ride at the top vs. a crazy, loopy ride at the bottom. It’s saying no one learns in one straight line. We all have moments when we feel smart and moments when we feel totally lost. And that’s okay! Just like a roller coaster, the journey of learning has thrilling highs and rattling lows, but everyone on the ride experiences those same twists and turns. In the end, it’s normal to scream on the way down and laugh about it later – that’s how learning to be a developer (or learning anything, really) goes. Keep hanging on, you’re doing fine!

Level 2: Confidence Crash Course

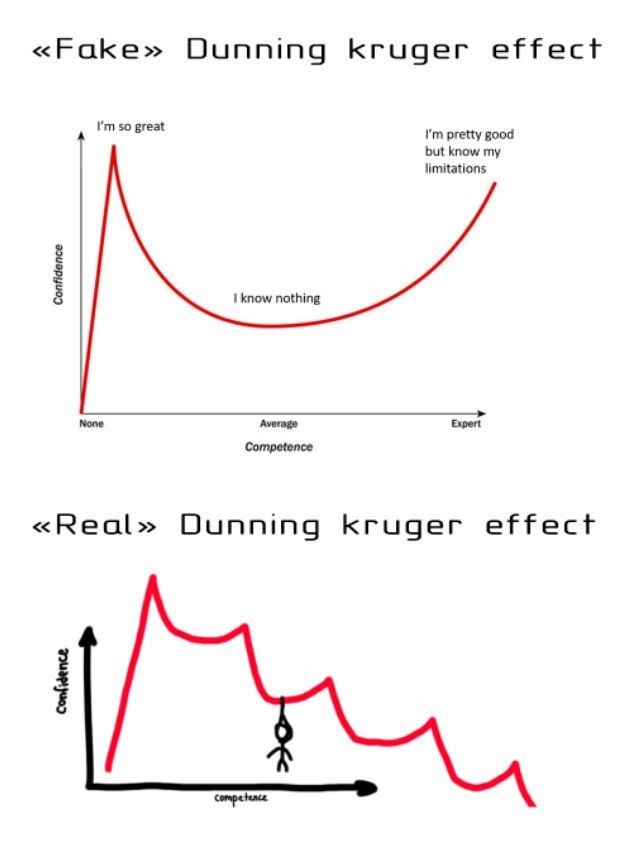
Let’s break down what’s happening in this meme. The graph is showing competence (skill level) on the X-axis from “None” to “Expert,” and confidence (how sure you are of your skill) on the Y-axis from low to high. The top panel – labeled “Fake” – is an idealized learning curve often associated with the Dunning-Kruger effect. Now, the Dunning-Kruger effect is a psychology concept which says: beginners often overestimate their ability because they don’t know what they don’t know. In simple terms, when you first learn a little about coding, you might feel super confident. For example, a new programmer writes a few simple programs successfully and thinks, “Wow, I’m really good at this!” – that’s the first peak (near “I’m so great” on the chart). But as they learn a bit more and encounter how vast and complex programming really is, reality sets in. They hit the “I know nothing” stage, where their confidence falls dramatically. This is that scary low point in the middle of the U-shape – the newbie suddenly realizes “Whoa, there’s a LOT I don’t understand at all.” Their actual skill (competence) might still be growing, but their perceived skill (confidence) plunges because they become aware of their ignorance. Finally, as they keep practicing and truly improve toward an expert level, their confidence climbs back up. By the time they’re very experienced, they might say, “I’m pretty good, but I know my limitations.” In other words, they trust their skills, yet they also understand there are areas they’re not an expert in. The top graph’s message is: with knowledge comes humility – first you’re naïvely confident, then overwhelmed and doubtful, and eventually confident and realistic.

The bottom panel, labeled “Real,” shows the same idea but in a much messier way. Instead of one smooth curve, the red line goes up and down repeatedly like a series of roller coaster loops. This is saying that in real life, a developer’s confidence doesn’t just dip once – it goes through many cycles of highs and lows. You don’t only have one big moment of “Oh no, I actually know nothing”; you have lots of those moments at different times. If you look closely, there’s a little stick figure drawn hanging on one of the downward spikes. That stick person is basically you or any developer feeling stuck and scared during a particularly low confidence moment. The line keeps spiking up and crashing down, which means as you slowly become more competent at coding (moving to the right, towards “Expert”), your confidence might shoot up, then fall, then rise, then fall again, over and over. For example, imagine you start a new project and at first things click — you think “Hey, I’ve got this!” (confidence rushes up). But then you hit a really confusing bug or a concept you’ve never seen before, and suddenly you feel completely lost — “I have no idea what I’m doing…” (confidence tanks). Then you solve the bug after some effort, and your confidence goes back up “Alright, I understand this now.” But of course, a day later a new challenge appears and you’re back to “Uh-oh, I actually don’t get this at all.” That’s the jagged up-and-down line in a nutshell. It’s the real learning curve for a developer: not a smooth road but a series of steep climbs and drops.

This meme resonates a lot with junior developers because it’s exactly what learning programming feels like. One week you might feel on top of the world after building a small app; the next week you feel like a total beginner when trying to debug a complicated error. Even more senior developers secretly experience this when they dive into a new technology – they just know to expect the roller coaster. The mention of impostor syndrome is important: that’s when even skilled people constantly feel like they’re not good enough, fearing they’ll be “exposed” as a fraud who doesn’t actually know anything. Those feelings often hit during the down moments of the red squiggly line. The key takeaway is that ups and downs in confidence are normal while learning. The “Fake” graph makes it look like you only struggle once in the middle, but the “Real” graph admits that you will struggle, then feel better, then struggle again many times. It’s a lighthearted way to say: Every developer rides this confidence roller coaster, so if you feel overconfident then later foolish, and then confident again, don’t worry – that’s just real life! This shared experience is exactly why the meme is both funny and comforting.

Level 3: Cognitive Roller Coaster

The top panel shows the textbook Dunning-Kruger effect graph, a smooth U-shaped curve plotting confidence vs competence. In theory, it works like this: a novice gains a tiny bit of knowledge and suddenly feels overconfident – that early red peak (often nicknamed “Mount Stupid”) where a new coder proudly thinks “I’m so great!” after a basic tutorial or two (we’ve all seen that happen, or been that person). As they learn more, reality hits: they become aware of how much they don’t know. Confidence collapses into the infamous valley of “I know nothing”, a humbling drop often accompanied by a bout of impostor syndrome. Finally, with a lot more experience, their confidence rises again on solid ground – the right side of the curve labeled “I’m pretty good but know my limitations.” Here a developer has true competence and healthy self-awareness. The tidy story is that you go from clueless to overconfident to wisely competent in one smooth journey.

The real developer journey (as the bottom panel hilariously illustrates) is far messier. Instead of one graceful curve, we get a jagged red line zigzagging like a volatile stock price – a wild roller coaster of confidence. Each spike upwards is another burst of overconfidence (for example, after fixing a tricky bug or finishing a project, you momentarily feel “I’ve got this, I’m an expert now!”). But then come the crashes: an unfamiliar error, a code review full of critique, or a production disaster surprise sends your confidence plummeting (“Wait, I actually know nothing…”). This cycle repeats again and again. The meme even draws a tiny stick figure dangling from one of the deep dips, representing a developer hanging on for dear life during a low point of DeveloperFrustration. It’s a perfect visual for those nights when you stare at a bug at 3 AM thinking, “Why can’t I solve this?!”

For seasoned engineers, this chaotic line is painfully relatable DeveloperHumor. It captures an unwritten truth in DeveloperCulture: gaining expertise is not a gentle cruise but a series of whiplash-inducing loops. Every new programming language, framework, or challenging project can put you right back on Mount Stupid, followed by another plunge into the abyss of doubt. Over time, those confidence peaks do get a bit lower and more cautious – you’ve been humbled enough times to know there’s no such thing as “easy” in software. In fact, the graph’s downward trend in peak height says it all: the more you learn, the more you realize you still have to learn, so you become naturally less cocky. And those despairing troughs? Even experienced devs aren’t immune to ImposterSyndrome – that persistent feeling of “I’m not actually good enough”. The meme is funny because it’s true: the real road from junior to expert is a bumpy ride full of self-delusion, self-discovery, doubt, and growth. Knowing this, we can all laugh at our past selves on that roller coaster and remember that every dip is just a normal part of the LearningCurve. So when you’re dangling in one of those valleys, take heart – you’re simply experiencing the messy reality of developer growth, just like everybody else. 🚀🎢

Description

This two-panel meme contrasts the 'Fake' and 'Real' Dunning-Kruger effect. The top panel shows the classic, simplified graph: a sharp peak of confidence at 'None' competence ('I'm so great'), a deep trough at 'Average' competence ('I know nothing'), and a gradual rise to 'Expert' competence ('I'm pretty good but know my limitations'). The bottom panel, labeled '«Real» Dunning kruger effect', depicts a much more chaotic and volatile graph. The red line of confidence repeatedly peaks and crashes, with a stick figure shown hanging by a noose from one of the troughs. This darkly humorous version suggests that the journey to expertise is not a smooth curve but a relentless, psychologically brutal cycle of fleeting confidence and crushing self-doubt. For senior developers, this 'real' version is deeply relatable, reflecting the constant struggle with imposter syndrome, the discovery of new 'unknown unknowns' in complex systems, and the emotional toll of a career in a rapidly changing field


Comments

7
Anonymous ★ Top Pick The classic Dunning-Kruger graph is for your first programming language. The 'real' one is for when you're a decade in and have to learn Kubernetes, Terraform, and the entire AWS ecosystem at the same time
  1. Anonymous ★ Top Pick

    The classic Dunning-Kruger graph is for your first programming language. The 'real' one is for when you're a decade in and have to learn Kubernetes, Terraform, and the entire AWS ecosystem at the same time

  2. Anonymous

    Real dev growth: confidence rockets after dockerising ‘hello-world’, nose-dives when Kubernetes asks for a readiness probe, spikes after pasting the StackOverflow YAML, then face-plants when the Istio sidecar triples latency - turns out the stick figure is just my pager hanging there

  3. Anonymous

    After 20 years in tech, I've learned that true expertise is just knowing exactly which Stack Overflow answer won't work in production and being able to articulate why in the post-mortem

  4. Anonymous

    The real Dunning-Kruger curve in software engineering looks less like a smooth U-shape and more like your production monitoring dashboard during a deployment - brief moments of confidence followed by cascading drops as you discover yet another edge case, legacy integration, or architectural decision that seemed brilliant at 2 AM but now haunts your code reviews. That stick figure? That's you at year 15, finally understanding that the more you know, the more you realize the entire industry is held together by duct tape, Stack Overflow answers from 2012, and the collective prayer that nobody touches the authentication service

  5. Anonymous

    Dunning - Kruger for distributed systems: confidence peaks at “just put it behind Kafka,” nosedives at “exactly-once,” bumps on idempotency, then digs a crater when GDPR meets event sourcing - right where your pager rings

  6. Anonymous

    Real Dunning-Kruger for 20-YoE architects: Peaks at system design doc, infinite valleys every time CAP theorem bites in prod

  7. Anonymous

    Experience is the cumulative sum of postmortems; by Staff level, the only thing you ship without a feature flag is skepticism

Use J and K for navigation