
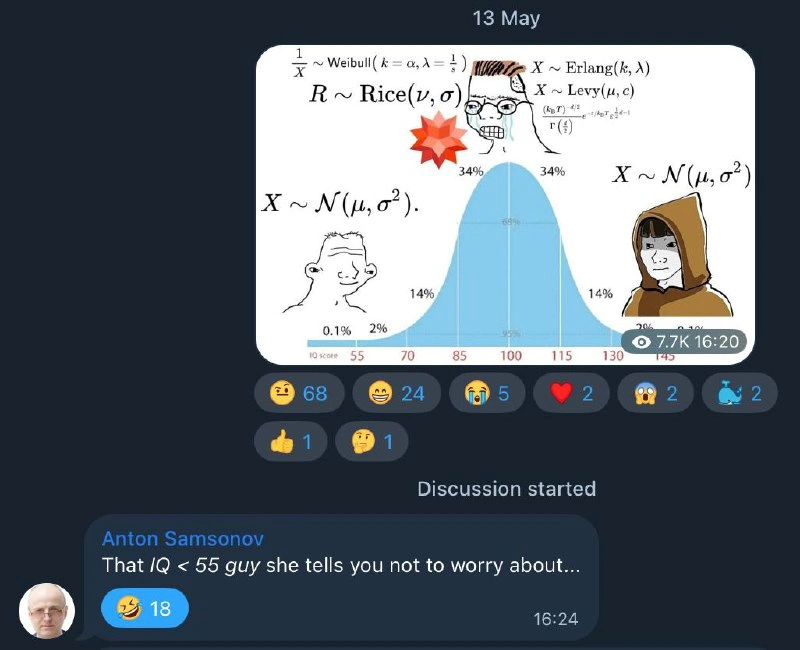
IQ Bell Curve: Normal Devs vs Statisticians Who Know Obscure Distributions
Description
A Telegram chat screenshot showing a meme posted on May 13th depicting an IQ bell curve (normal distribution) with hand-drawn characters at different points. The curve shows IQ scores from 55 to 145 with percentage distributions (0.1%, 2%, 14%, 34%, 34%, 14%, 2%). At the low IQ end (~55), a simple angry stick figure is labeled with basic math 'X ~ N(mu, sigma^2).' with a period. At the peak (average, ~100), a character with an angry/exploding head is shown surrounded by complex statistical formulas: '1/X ~ Weibull(k=alpha, lambda=1/s)', 'R ~ Rice(nu, sigma)', 'X ~ Erlang(k, lambda)', 'X ~ Levy(mu, c)', and other advanced probability distributions. At the high IQ end (~130-145), a hooded/wise monk figure is labeled with the same simple 'X ~ N(mu, sigma^2)' notation. Below the meme, the post has 7.7K views and various emoji reactions (68 grinning, 24 laughing, 5 crying, 2 hearts, 2 mindblown, 2 alarm). A commenter named 'Anton Samsonov' writes: 'That IQ < 55 guy she tells you not to worry about...' with 18 laughing reactions. The meme uses the 'midwit' bell curve format to suggest both low and high IQ people use simple normal distributions, while average people overcomplicate things with exotic probability distributions


Comments
2Comment deleted
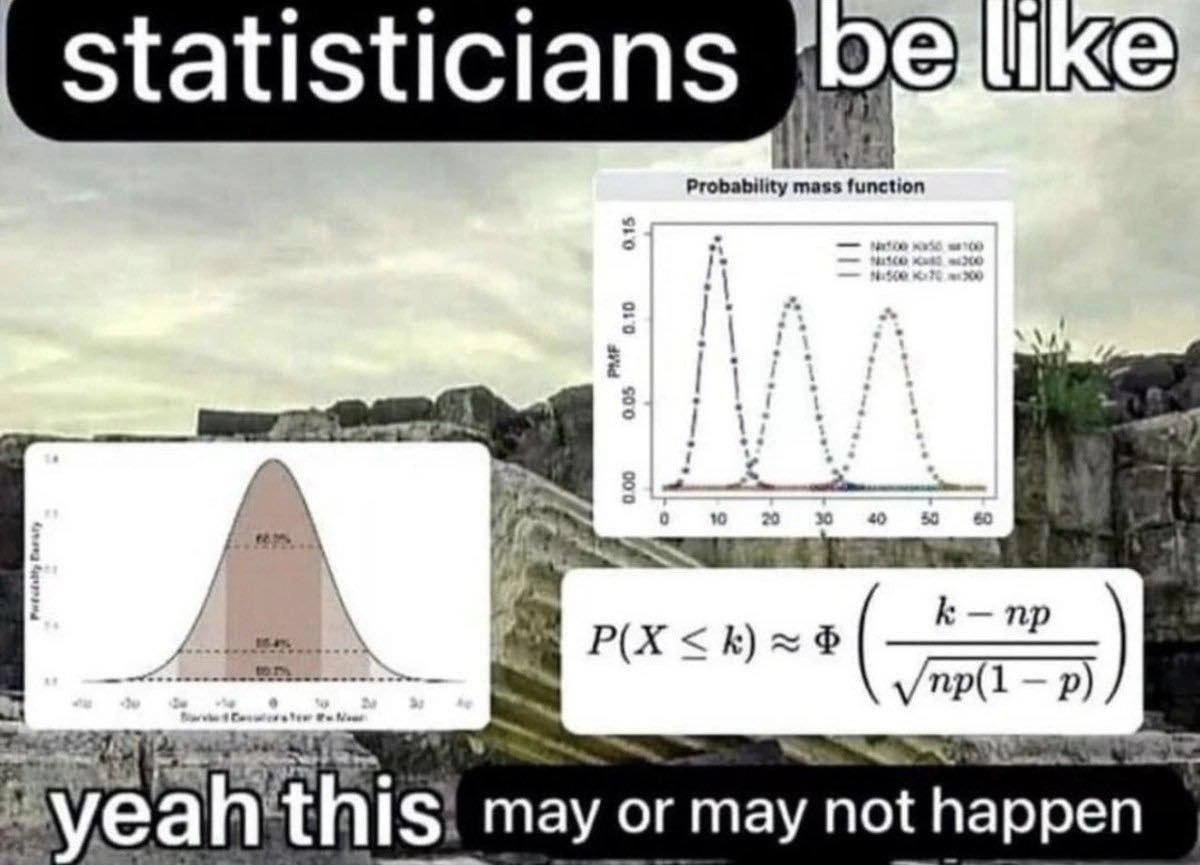
Senior statisticians and interns agree: everything is normally distributed. It's the mid-level data scientists fitting Weibull distributions to their lunch break durations
I would say this is a normal meme Comment deleted