
SRE 100% Uptime Report Meme Explained
Homer savors a perfect weekly uptime report: 100.000% and zero incidents. The dive explains availability, SLOs, error budgets, and why green dashboards need trustworthy measurement.
Level 1: The Quiet Baby Monitor
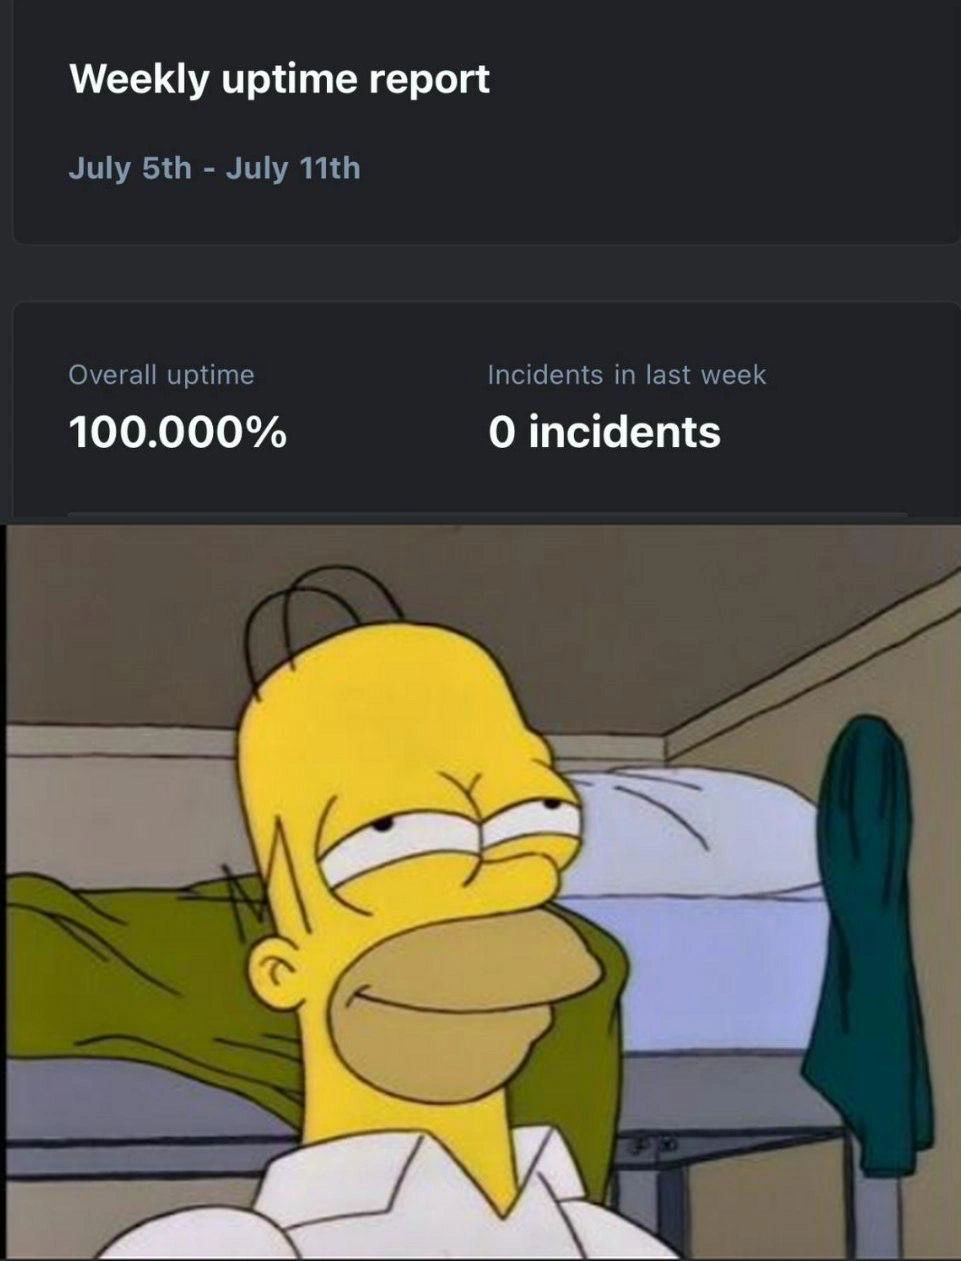
It is like watching a baby monitor for an entire week and never hearing crying, crashing, or an alarm. Homer’s pleased face is the tired parent realizing everything stayed peaceful and nobody had to leap out of bed. The joke is that, for the person responsible for keeping a website alive, nothing happening can feel like the best thing that happened all week.
Level 2: No Pages, No Problems
Uptime is the share of a measurement period during which a service is considered available. A simple calculation is:
uptime percentage = available time / total measured time × 100
The difficult part is defining “available.” If an application loads but cannot save data, is it up? An infrastructure probe may say yes while a user says no. Good monitoring watches known failure conditions with metrics and alerts. Broader observability combines metrics, logs, and traces so engineers can investigate unexpected behavior and understand why it happened.
A production incident is a problem in the live system serious enough to require coordinated response. The on-call engineer is the person scheduled to receive alerts and begin that response. Typical work includes confirming the impact, limiting damage, contacting the right owners, restoring service, and later helping document what should prevent a repeat.
The meme’s layout is therefore a tiny cause-and-effect story:
- The dark status card shows a completely clean weekly reporting window.
100.000%says the monitored service never registered as unavailable.0 incidentssays no event entered the incident process.- Homer’s relaxed face shows the emotional outcome: the person carrying the pager was allowed to remain relaxed.
For a junior engineer, the useful lesson is not that a green dashboard guarantees perfection. It is that reliable systems pair customer-centered measurements with actionable alerts. Before celebrating, check that telemetry is fresh, important user journeys are covered, and the incident counter represents the same scope as the uptime figure. Then celebrate. Production provides few enough opportunities.
Level 3: Green Until Proven Otherwise
Weekly uptime report July 5th - July 11th
Overall uptime 100.000%
Incidents in last week 0 incidents
The top half presents the two numbers an on-call engineer almost never trusts at first glance; the bottom half shows Homer Simpson savoring them anyway. His narrowed eyes and deeply satisfied grin capture a very specific form of SRE happiness: not the excitement of shipping a feature, but the luxurious absence of a page, an escalation, or a 3 a.m. conversation beginning with “Are you near a laptop?”
The three decimal places make 100.000% look impressively scientific, but availability is only as meaningful as its measurement. A service-level indicator might count successful HTTP responses, completed user journeys, healthy synthetic probes, or simply whether one endpoint answered. Those definitions produce different realities. If the monitor checks the public home page while checkout is broken, the report can remain immaculate as revenue quietly leaves through a side door. Observability dashboards do not lie, exactly; they answer the question they were configured to answer, which is sometimes a more dangerous talent.
“0 incidents” has similar ambiguity. An incident is usually a tracked operational event, not every defect or moment of user pain. The figure could mean the system was genuinely stable. It could also mean alerts were muted, thresholds were too generous, telemetry stopped arriving, customers suffered below the escalation threshold, or nobody formally opened an incident record. A healthy monitoring system needs a way to distinguish “nothing bad happened” from “the instruments went dark.” That is why mature teams alert on missing data, compare several signals, and test the alert path itself.
The ideal interpretation is still perfectly plausible: boring engineering worked. Capacity planning left headroom, deploys were gradual, changes had fast rollback paths, dependencies behaved, backups were not needed, and prior incident reviews eliminated repeat failures. Reliability often appears visually uneventful because its achievements are preventative. The meme gives that invisible labor a victory portrait. Homer’s expression is what a week of successful toil looks like when success produces no dramatic screenshot.
An SLO, or service-level objective, sets a target such as a chosen proportion of successful requests over a defined window. The gap between that target and perfection forms an error budget: a controlled allowance for failure that lets teams balance reliability against shipping changes. A service with a 99.9% objective does not need to chase literal immortality, because the last fractions of availability can be extraordinarily expensive. A perfect week therefore adds breathing room to a longer measurement window; it does not prove the architecture has transcended entropy.
The dashboard also compresses away the human cost that makes the result feel so good. On-call duty changes how people sleep, travel, and relax because any notification might become a production emergency. Repeated false alarms create alert fatigue, while repeated real alarms create burnout. “Zero incidents” means the engineer may have spent a week behaving like a normal person instead of acting as a biological failover mechanism for software. That is enough to justify Homer’s almost indecent contentment.
Zero incidents means either flawless reliability or flawless alert suppression.