
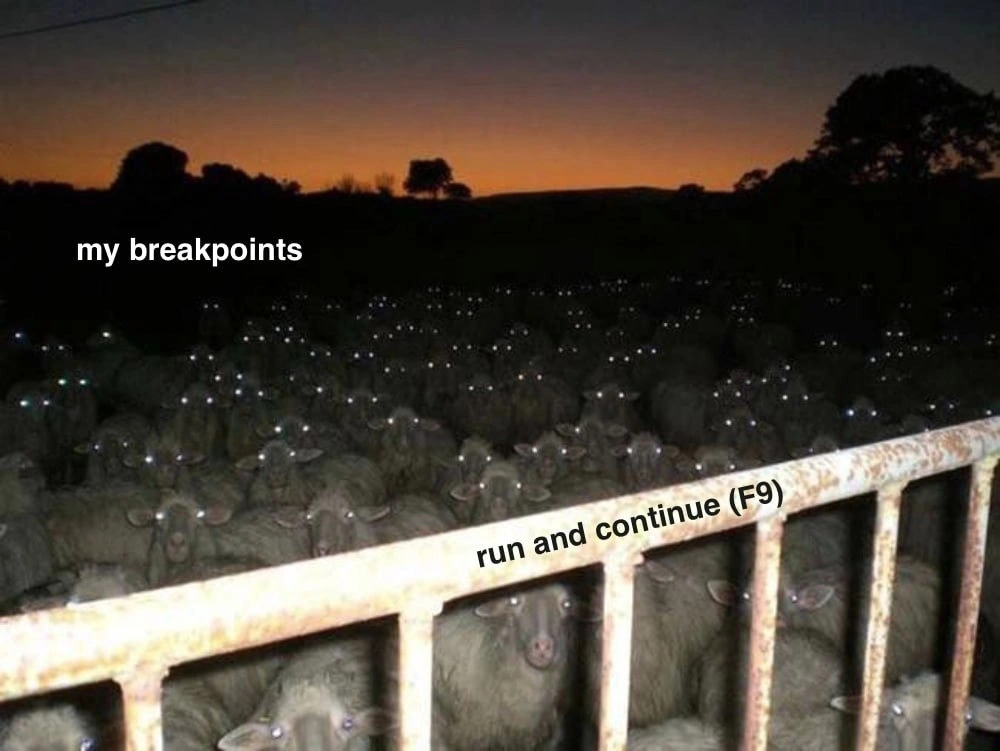
The Terrifying Gauntlet of Hitting 'Continue'
Description
This meme uses a dimly lit, slightly unsettling photograph of a massive flock of sheep packed together in a field at dusk. Their eyes are all reflecting light, appearing as dozens of glowing white dots in the darkness, staring forward. In the foreground, a rusty metal gate pens them in. The humor is conveyed through overlaid white text. The vast sea of sheep with glowing eyes is labeled 'my breakpoints'. The gate in the foreground is labeled 'run and continue (F9)'. The joke is a visual metaphor for the software debugging process. The numerous, watchful sheep represent the many breakpoints a developer has scattered throughout their code to catch a bug. The 'run and continue' command (often mapped to the F9 key in IDEs) is the action that lets the program's execution proceed, only to be inevitably stopped by the next lurking breakpoint. The eerie atmosphere of the image humorously captures the feeling of navigating a complex, bug-ridden codebase, where every step forward is watched and halted by a sea of potential issues

Comments
9Comment deleted
I'm not saying I use too many breakpoints, but when I press F9, my IDE asks if I want to 'release the horde' and my CPU fan starts playing boss music
Hit F9 and every forgotten breakpoint across fifteen microservices lights up like ZooKeeper watch events after a partition - suddenly I’m herding sheep instead of shipping code
After 15 years in the industry, you realize the real horror isn't the production bug at 3am - it's opening last week's debugging session and finding 47 conditional breakpoints you set while chasing a race condition that turned out to be a timezone issue in the logging framework
When you set 'just one quick breakpoint' to debug a responsive layout issue at 2 AM, but now you're staring at 47 breakpoints across 12 files, each one looking back at you with those glowing eyes, silently judging your life choices. The F9 key becomes your only friend - or your worst enemy - as you frantically try to remember which breakpoint was actually relevant. Spoiler: it was the one you removed three iterations ago
When your system only behaves with a debugger attached, breakpoints stop being a tool and start being semaphores - F9 is release(); congrats on accidentally implementing flow control with your IDE
Resuming a microservices debug is poor man’s distributed tracing - every stray breakpoint lights up a service I forgot to mock
20+ YoE wisdom: breakpoints everywhere catches the bug in prod logs you forgot to check
lmao Comment deleted
hard. please describe Comment deleted