
Museum Of Meaningless Metrics
Description
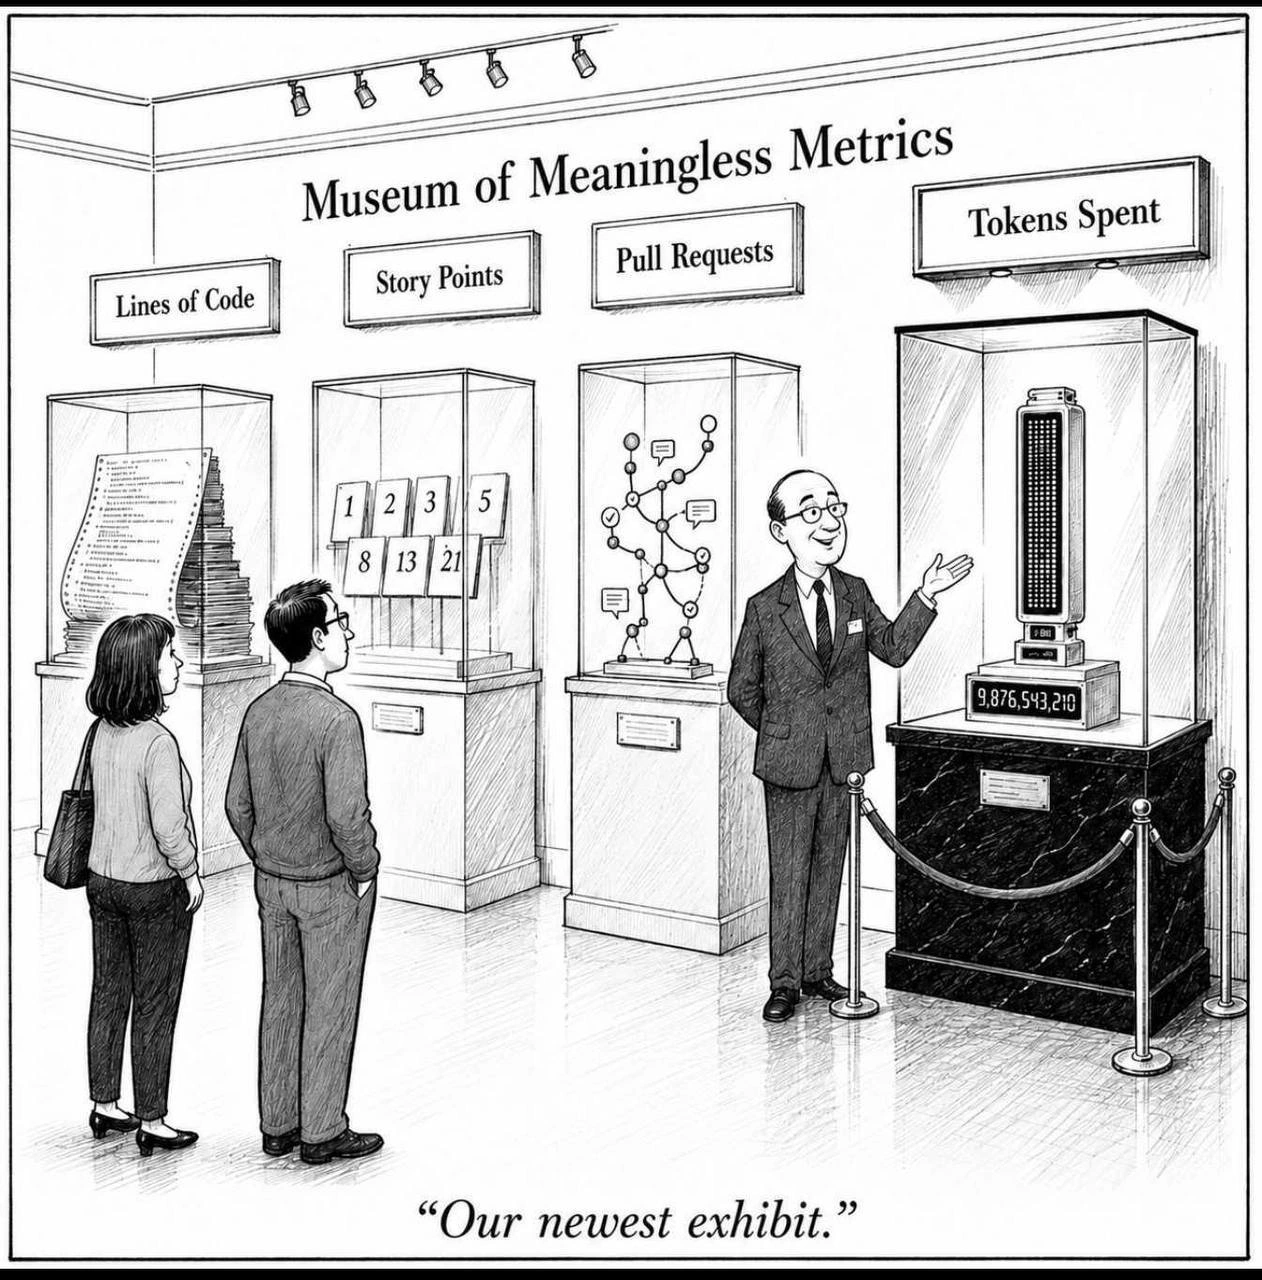
A black-and-white cartoon shows a museum gallery labeled "Museum of Meaningless Metrics" across the back wall. Four exhibit cases are labeled "Lines of Code," "Story Points," "Pull Requests," and "Tokens Spent"; the first contains a huge stack of printed code, the second shows cards with Fibonacci-like estimates "1, 2, 3, 5, 8, 13, 21," the third displays a branching pull-request diagram, and the fourth features a pedestal counter reading "9,876,543,210" under a tall token-meter-like object. Two visitors look on while a smiling museum guide gestures toward the "Tokens Spent" display, and the caption at the bottom says: "Our newest exhibit." The technical joke is that engineering organizations keep inventing measurable proxies for value, and LLM-era token burn has joined lines of code, story points, and PR counts as another easy-to-track but easy-to-misuse metric.


Comments
11Comment deleted
Goodhart's law finally got a token budget and immediately became a dashboard.
The customer-value exhibit is across the hall; apparently it’s still empty.
(Ai slop) Comment deleted
this Comment deleted
where is USCS? Comment deleted
what's the story points Comment deleted
ah such a blissful ignorance 😏 Comment deleted
https://atlassian.com/agile/project-management/estimation tl;dr a measure for some task's value Comment deleted
another failed attempt at creating estimates that are real Comment deleted
MIPS is missing, and Watts PMPO Comment deleted
Wait till someone starts yo mix them up tokens/line of code or pull requests/SP Comment deleted