
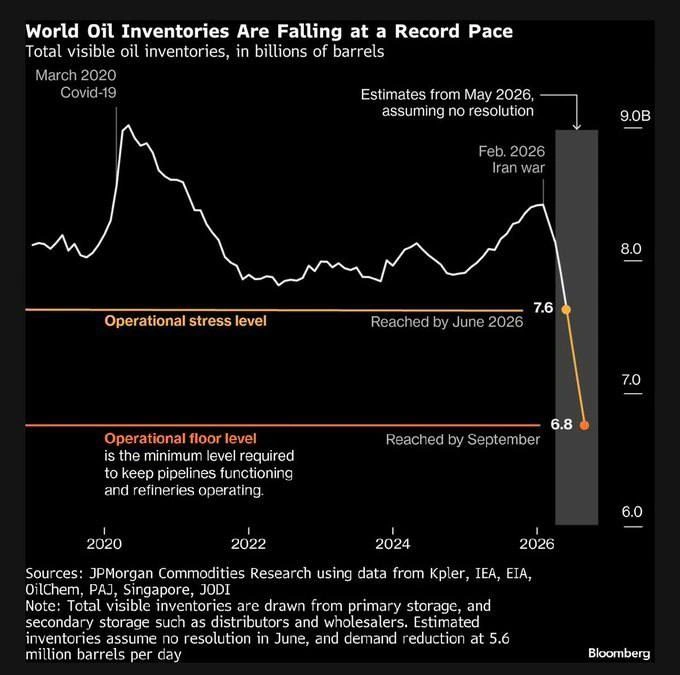
Bloomberg Chart: World Oil Inventories Plunging Toward Operational Floor by 2026
Description
A dark-themed Bloomberg line chart titled 'World Oil Inventories Are Falling at a Record Pace', subtitled 'Total visible oil inventories, in billions of barrels'. A white line tracks inventories from 2020 to 2026, with annotations for 'March 2020 Covid-19' (a peak near 9.0B) and 'Feb. 2026 Iran war', after which a steep projected drop (shaded gray, 'Estimates from May 2026, assuming no resolution') falls to 7.6B at the orange 'Operational stress level' line ('Reached by June 2026') and 6.8B at the red 'Operational floor level' line ('Reached by September'), defined as 'the minimum level required to keep pipelines functioning and refineries operating'. Footer cites JPMorgan Commodities Research using data from Kpler, IEA, EIA, OilChem, PAJ, Singapore, JODI, with a note that estimates assume no resolution in June and demand reduction at 5.6 million barrels per day. Not a developer meme - this is geopolitical/energy news content, though it exemplifies effective threshold-annotated time-series visualization

Comments
5Comment deleted
Finally, a production system where 'running below operational floor level' isn't just our on-call dashboard - and their rollback plan is somehow worse than ours
The global energy system is approaching OOM, and its autoscaler runs on geological time.
And apparently nobody knows when Insider Trading Championship is ending 🤷♂️ Comment deleted
you're asking when the people whose "net worth" is going up are going to willingly stop that number from going up? Comment deleted
Who still needs real traveling when Google Maps with Street View are out there? 🤓 Comment deleted