
Gantt Chart Planning Fallacy Meme Explained
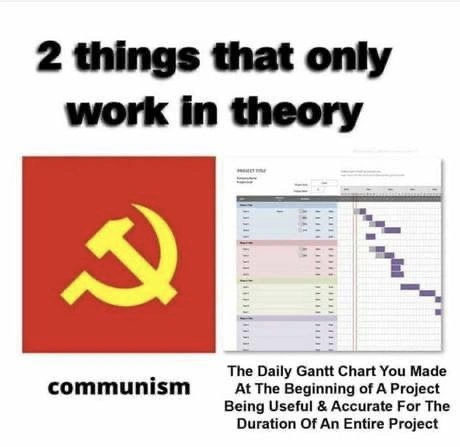
A meme pairs communism with a day-one Gantt chart under “things that only work in theory.” The dive explains waterfall schedules, scope creep, blockers, and why rigid project timelines rarely survive first contact with real development.
Level 1: Works on Paper Only
Imagine you draw a perfect plan for your day on a piece of paper. You write down: “9:00 AM - play game, 9:30 AM - draw pictures, 10:00 AM - go outside...” It looks great on paper, like nothing can go wrong. But then real life happens: your friend comes over at 9:20 and wants to play a different game, or it suddenly starts raining when you wanted to go outside. Your perfect schedule falls apart because things changed. This meme is laughing at that same idea but in a grown-up way. It says making a super detailed project plan for a long time is just like an idea that sounds good in theory but doesn’t actually work in real life. It compares it to communism, which is a way some people thought society could be perfect if everyone shared everything – a nice idea in theory, but when it was tried in the real world, it didn’t work out as planned. So the joke is: some things look perfect only in theory (like on paper or in our head), but once you try them for real, they usually don’t go perfectly at all. We find it funny because everyone knows the feeling of a plan going completely off track. It’s like saying, “Sure, on paper it was all figured out – but in reality, nope!” The meme uses an extreme example (a political ideal and a strict project schedule) to make the point that plans often sound easier than they actually are, and that contrast is what makes us smile.
Level 2: Scheduled to Fail
This meme pokes fun at project management gone wrong, comparing a strict project schedule to something famously unrealistic. On the right side of the image, we see a Gantt chart – a type of bar chart that project managers use to map out tasks over time. Each colored bar represents a task (like “Design UI” or “Write API Code”) and stretches from its start date to end date on a timeline. The idea is to plan every day of a project in advance so you know what should happen when. This approach is a hallmark of waterfall_planning, where you do detailed upfront scheduling: first we’ll do A, then B, then C, each in its own phase. It looks very orderly in theory. The meme’s caption jokes about that initial daily Gantt schedule “being useful & accurate for the duration of an entire project” – implying that once you’ve made this detailed plan at the project’s beginning, it will remain perfectly correct until the end.
Why is that funny (or rather, why is that ridiculous)? Because in real software projects, things never go exactly as initially planned. Scope often changes: for example, halfway through development, the client or your boss might say “Actually, can we also add a password reset feature here?” or “Users don’t like the blue design, let’s tweak it” – meaning new tasks appear or original tasks need rework. That wasn’t in the original chart! There’s also the issue of blockers: unexpected obstacles that hold up progress. Maybe a developer can’t start Task B on time because Task A isn’t finished yet (it ran late), or perhaps an external service you depend on went down, or someone on the team got sick for a week. Each blocker breaks the original schedule’s assumptions. The phrase planning_fallacy comes up a lot in this context – it’s the tendency for people to underestimate how long things will take. Engineers might estimate “2 days for this feature” without realizing a tricky bug will make it 4 days. Add a few misestimates and suddenly your beautifully crafted timeline is off by weeks.
Think about a time you had a school project or a coding assignment and made a schedule: “Week 1: research, Week 2: draft, Week 3: finalize.” Nice and tidy. But then reality struck – maybe research took longer than expected, or you had exams that delayed your work, and you found yourself scrambling in Week 4. A Gantt chart is like a big grown-up version of that schedule. It assumes we know exactly how everything will go ahead of time. But software development, like any creative work, is full of surprises. Junior developers quickly learn that real world vs theory is a big theme in engineering. You might plan to build a feature in 3 days, but discovering a dependency issue can turn it into 3 weeks.
The left side of the meme gives the clue by analogy: it shows the symbol of communism, labeled “communism,” under the heading "2 things that only work in theory". Communism is an economic and political idea that in theory is supposed to create equality and efficiency by having the government centrally plan everything. While it’s an appealing idea on paper (everyone shares, no one is poor, the government plans production so there’s no waste), in actual history it often didn’t work out – economies stagnated or people weren’t motivated to work hard when every outcome was fixed. In short, the communism_reference implies “a nice idea in theory, but a mess in practice.” The meme is saying a rigid, daily-updated project schedule made at the start of a software project is the same kind of thing: it sounds great in theory (“we have a plan, what can go wrong?”) but is disastrous in reality (“almost everything went off-plan!”).
In modern software teams, this is why Agile methodologies became popular. Agile doesn’t try to predict the entire project timeline from day one. Instead, teams plan in small iterations (like 1-2 week sprints) and frequently re-evaluate. This way, when changes happen, you adjust the plan bit by bit rather than sticking to a failing long-term Gantt chart. A rigid project schedule (like a waterfall-style Gantt chart covering many months) can’t easily absorb change, so teams stuck with one often experience a lot of stress and deadline pressure when (inevitably) things slip. The meme humorously implies that believing your initial Gantt chart will stay useful through the whole project is as naïve as believing a utopian theory will work flawlessly in real life. It’s a classic case of misaligned expectations: expecting theory to match reality exactly. Engineers grin (or groan) at this because many have lived through a project where the meticulously planned timeline blew up, and they had to work late or constantly redo the schedule. In short, the meme uses an over-the-top comparison to highlight the planning fallacy in software projects: some plans only work on paper, not in the real world.
Level 3: Central Planning Collapse
"In theory, there's no difference between theory and practice. In practice, there is."
Both halves of this meme highlight grand plans that crumble under reality. On the left, we have the emblem of communism – a centrally planned utopia that sounds flawless on paper but historically face-planted in practice. On the right, we have a meticulously color-coded Gantt chart from day one of a software project, promising that every task will march in line, day by day, until release. Seasoned engineers immediately recognize the satire: waterfall planning and rigid project schedules are the planned economies of the software world. Just as a centralized five-year economic plan might run aground on unforeseen problems (or human nature), a detailed up-front project timeline will be wrecked by shifting requirements, unexpected bugs, and the chaos of real development.
In a perfect world (or a perfect theory), your project timeline would be accurate for the duration of the entire project. Every task would take exactly as long as expected, every dependency would arrive on time, and nothing blocks progress. But in the real world, this daily Gantt chart becomes a beautiful lie by week two. Scope changes? Guaranteed. A feature that the client swore was final will evolve or expand once they see an early demo. Blockers? You bet. Perhaps an external API goes down, a key team member gets sick, or another team delivers something late. Suddenly the neat bars on your timeline are as outdated as a 1950s economic plan in a rapidly changing market. The meme’s punchline lands because experienced devs know that a Gantt chart only works in theory, much like that idealistic political blueprint.
Let’s get specific: the meme text on the right facetiously describes “The Daily Gantt Chart You Made At The Beginning of a Project Being Useful & Accurate For The Duration Of An Entire Project.” This absurdly long caption is itself a joke – it’s basically saying “that initial plan staying truthful the whole way through”. We all know that’s fantasy. No battle plan survives first contact with the enemy, and in software, no project plan survives first contact with reality. As soon as you start coding, reality fights back. Integration hell, performance problems, Murphy’s Law – something will render your original schedule bunk. The planning fallacy (a well-documented tendency to underestimate task durations) haunts most project timelines. Engineers, optimistic by nature or by pressure, give estimates assuming a smooth ride. Management stacks those estimates into a Gantt chart as if they were drawn from a crystal ball. It’s like a communist commissar believing factory quotas will magically be met each month: sure, comrade, what could go wrong?
Waterfall planning (plan everything first, then execute in sequence) has a core flaw: it assumes we know everything at the start. We don’t. In contrast, iterative approaches (hello Agile and Scrum) were practically born from the ashes of failed waterfall projects. They acknowledge that plans will change; you adjust as you learn more. A rigid Gantt chart is the embodiment of project_schedule_rigidity – it doesn’t gracefully accommodate change. When reality diverges, you either constantly rework the chart (turning your “plan” into a daily chore of moving goalposts) or you ignore the deviations and drive the team into a death march trying to meet unrealistic dates. Neither is a good outcome. The dark humor here is that we’ve all been there: sitting in status meetings, watching a project manager solemnly update a Gantt chart with new dates in a doomed attempt to pretend the project is still on track. At some point the chart stops being a planning tool and becomes historic art – a chronicle of missed deadlines and shifted milestones.
To underline the irony, consider a quick comparison between theory and reality in project management:
| Theory (Planned Economy) | Reality (Chaotic Market) |
|---|---|
| All tasks neatly scheduled in advance | Tasks delayed, resequenced on the fly |
| Perfect information (we know all features) | Incomplete info (new features added late) |
| Everyone marches to the plan | Devs firefight and adjust priorities |
| Deadlines are immovable and met | Deadlines get pushed or features dropped |
| Plan makes everyone efficient | Plan becomes outdated overhead |
The left column is the idealistic vision (whether of a utopian economy or a utopian project), and the right column is the messy truth. The meme gets belly laughs from engineers because it’s engineering irony at its finest: we often create these detailed plans knowing full well they’ll disintegrate, much like we read idealistic political manifestos knowing reality will skew them. The juxtaposition of a communism_reference (the ultimate “great in theory, disastrous in reality” example) with a gantt_chart is hyperbole that hits home. It’s a critique of misaligned expectations – where management's belief in a tidy schedule clashes with the developer’s lived experience of inevitable chaos. In summary, the meme cleverly calls out the absurd optimism of upfront project schedules. A daily Gantt chart that stays useful through an entire software project is as mythical as a perfectly planned society: a fun idea on paper, but start working and the real_world_vs_theory gap becomes painfully obvious.

The only thing a Gantt chart successfully predicts is the exact moment when the project will deviate from the Gantt chart
The only truly immutable artifact in our pipeline is the Gantt chart we printed on day 0 - nobody’s dared to rebase it since reality hit prod
The only difference between a Gantt chart and a blockchain whitepaper is that at least the whitepaper admits it's speculative fiction from the start
The Gantt chart isn't a plan, it's a historical document - written before the history happened, and equally accurate
The Gantt chart is the software industry's most optimistic fiction - a beautiful artifact that captures the exact moment before reality, scope creep, and 'just one more quick feature' conspire to make it a historical document of naïve hope. Like communism, it assumes perfect information, rational actors, and no unexpected dependencies. In practice, both encounter the same fatal flaw: they underestimate the chaos inherent in complex systems involving actual humans. The only difference is that we're still required to update the Gantt chart every sprint to maintain the illusion of control
Initial Gantt charts are CRDTs - after enough merges, the only convergent value is 'behind schedule'
The only thing more theoretical than communism is a fixed-scope software project
A Gantt chart at project kickoff is optimistic locking for time - looks right until one cross-team dependency writes to reality, and you rebase the whole timeline to “next quarter.”
What could possibly go wrong? 🤔
Communism doesn't work even in theory.
3. A huge app with 100 microservices covered by unit tests only, without any integration or selenium tests
he just left (or never joined) and not banned
PS: The reason I pick farmer as example because no one work seriously and that’s why everyone is starving because there is no enough food.
Communism can only work within uniform society of ultimate motivated altruists.
Humans cannot do it without biological altering & removal of conscious selves to become a mammalian hive species